Classical statistics
Probability theory
Probability theory is the mathematical foundation for statistics, but in contrast to probability theory statistics is an applied science concerned with analysis and modelling of data. Check out Thomas Bayes, Pierre-Simon Laplace and Carl Gauss for history.
Bayes’ rule
Bayes’ rule describes the probability of an event, based on prior knowledge of conditions that might be related to the event.
\[P(A|B) = \frac{P(B|A) P(A)}{P(B)}\]Exploratory data analysis
Check out John Tukey for history.
Yuri Carvajal’s check list
- Identify the dataset:
- What’s dataset source?
- What’s dataset date/time?
- How many records has?
- How many pure duplicates contains?
- What type is each column?
- Check codification, labels and missing values
- Identify modes, asymmetries, outliers, clusters, correlations and other patterns
- Identify statistical inconsistencies
- Identify technical (domain) inconsistencies
- Compatibility with other users (export to csv, sql, etc)
Estimates of location
- Mean / average (the sum of all values divided by the number of values)
- Weighted mean (the sum of all values divided by the sum of weights)
- Median (the value that half values lies above and half lies below)
- Weighted median
- Trimmed mean (averages after n “extreme values” are removed from top and bottom)
- Robust (not sensitive to extreme values)
- Outlier (values very different from most of data)
Estimates of variability:
Variability also called dispersion, measure whether the data values are tighly clustered or spread out.
- Deviations / errors / residuals (the difference between the observed values and estimate of location)
- Variance / mean squared error (the sum of squared deviations from mean divided by values count - 1)
- Standard deviation / l2-norm / Euclidian norm (the squared root of variance)
- Mean absolute deviation / l1-norm / Manhattan norm (the mean of absolute values of the deviations from the mean)
- Mean absolute deviation from the median (the media of the absolute values of the deviations from the median)
- Range (the difference betweeen the largest and the smallest values in data set)
- Order statistics / ranks (Metrics based on the data values sorted from smallest to biggests)
- Percentile / quantile (the value such P percent of the values take on this values or less and 100-P take on this value or more)
- Interqurtile range / IQR (The diference between the 75th percentile and the 25th percentile)
Exploring distribution
- Box / box and whiskers plot
- Frecuency table and histograms
- Density Estimates
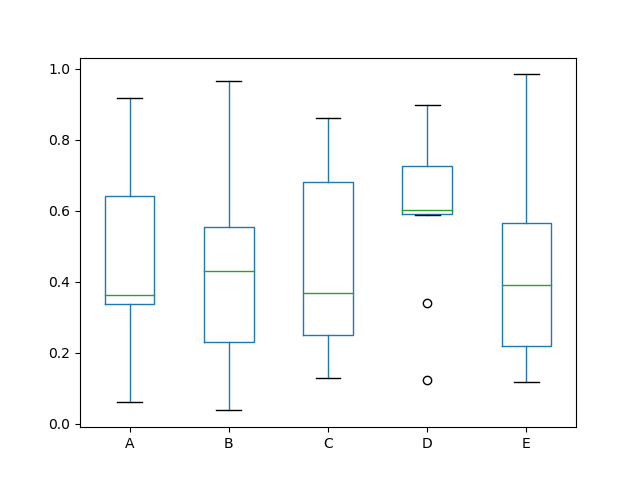
Boxplot / box and whiskers plot
A plot ntroduced by Tukey as a quick way to visualize the distribution of data,
# Pandas example
df = pd.DataFrame(np.random.rand(10, 5), columns=['A', 'B', 'C', 'D', 'E'])
df.plot.box()
Binary and categorical dataset
- Mode (the most occurring category or value in a data set)
- Expected value (when categories can be associated with a numerica values, this give an average value base on a category’s probability of occurrence)
- Bar charts
- Pie Charts (Florence Nightingale)